For as long as I can remember educators have been making students fill out pen and paper reading logs. Just look on Teachers Pay Teachers and you can find hundreds of examples of them. What knowledge do we really gain from these log, other than seeing if students are being compliant in reading? The data from these logs is almost never used for anything else until now! Thanks to Google Forms & Google Data Studio I have transformed the traditional reading log into data that is useful, and is constantly being updated and available for teachers, students, administrators to see in real time.
Last year we implemented an independent reading program in our English classes where the students and teachers read 15 minutes a day 3 days a week from a book of their own choosing. We did not require students to fill out any paperwork on the books. When teachers this year started talking about the program we decided we wanted a quick and easy way to track what the students were reading and also a way to help students get recommendations for good books to read. Since this summer I had students use Google Forms to track their Summer Reading, we decided to make a quick Google Form for students to fill out at the end of the book. Thanks to Google Data Studio I was able to aggregate the data from the responses into the charts and graphs that automatically update when new responses to the Google Form are added. I, not being a Google Sheets expert needed my husband's help to make this happen. I highly recommend if you are not Google Sheets or Excel savvy getting someone to help you design your Data Studio Infographic. (see mine below)
With a little forethought when creating the form fields and by using some of the built in functions Data Studio provides to help normalize the data set, you can set yourself up nicely. One of the most important things to remember is that since you're going to be trying to parse results from multiple fields (i.e. what author was read most often by 6th graders, or who the top authors are in the most popular genres), it's critical that the form is designed in a way that minimizes data entry inconsistencies. Separate fields for the student's last name, for example, will stave off situations where a student enters their name as Doe, Jane for the first book she reads and Jane Doe for the second. Also, having pull-down lists for things like genre or teacher's name makes it impossible to have misspellings or duplicate entries with different spellings. Once you're in Data Studio, you can further normalize the data by forcing text entry fields to be all upper-case.
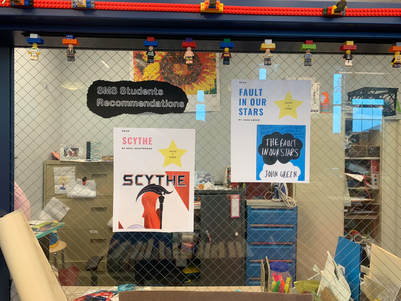
From there, the sky is the limit. My husband says that even if you know Google Sheets and Excel, the functions inside Data Studio are kind of a hybrid of spreadsheet functions and database design functions, so sometimes it take a little experimentation (and lots of failures) to finally get the data to present in the way you want it. That said, your patience (and head banging) will pay off in the long run since you now have a customized inforgraphic that updates itself!! It's also easy to share with staff and administrators thanks to Googles sharing features and can even be embedded on your library or school's webpage. I have mine on the front page of my website for all to see. I also took the data from the Google Forms and made posters featuring books that the students recommended using Canva that are now on display behind my circulation desk. The students are so excited to see their recommendations now available for others to see & its helping students find books to read. Google Forms and Google Data Studios has totally transformed the traditional reading log for the SMS Community and I hope you will consider using these tools to transform yours.
1 Comment
|
AuthorElissa Malespina is the High School Librarian at Verona High School and a Presenter, Author and much more. The views are my own. Find my full resume above. Archives
December 2020
Categories
All
|
- Trouble In Censorville
- Educational Equity Advisors
- AI School Librarian
- About Me
-
Presentations
- Information Privilege and Equity
- Collaborating to Create Policies Against Challenges & Bans
- How Future Ready Librarians Can Help Solve Problems
- It's Not The Complicated -Future Ready Librarians
- Best Websites
- Fighting Cuts - An Advocacy BluePrint
- Being a Librarian in the Age of Alternative Facts
- Future Ready Librarian
- Techspo 18- Future Ready Librarian
- Out of the Box Collaborations
- Augmented Reality in Schools and Libraries
- Augmented Reality in the Classroom with Aurasma
- Breaking down the classroom walls with Google Hangout
- Branding Your School and Library
- Connected Librarian
- Edmodo in the Classroom
- ISTE Forum - Marketing Your Library
- Library Trac
- Makerspaces
- Marketing Your Library - Keynote
- Making Yourself Relevant in an Age of Computers
- Making a QR code out of your Noodletools Work Cited
- Resume
- Understanding Inclusion Poster
- Thoughts on Technology - Blog
- Publications
- Interviews
- Virtual Debate
- Virtual Poetry Summit


 RSS Feed
